

The NWSL playoff picture after 12 games
Past seasons suggest most of the playoff field is already in place. The question now is which contenders can rise above – or fall below – the line after the summer break


The NWSL season just entered its CBA-mandated summer break, which means it’s a good time to take stock of the table. Each team has played between 11 and 13 matches, enough to really start to show their quality, or lack thereof. Even though the expanded league and early break mean the season isn’t yet halfway done – each team will have played 30 games by the season’s end – it’s not entirely too early to predict which might be the eight teams that make the playoffs.
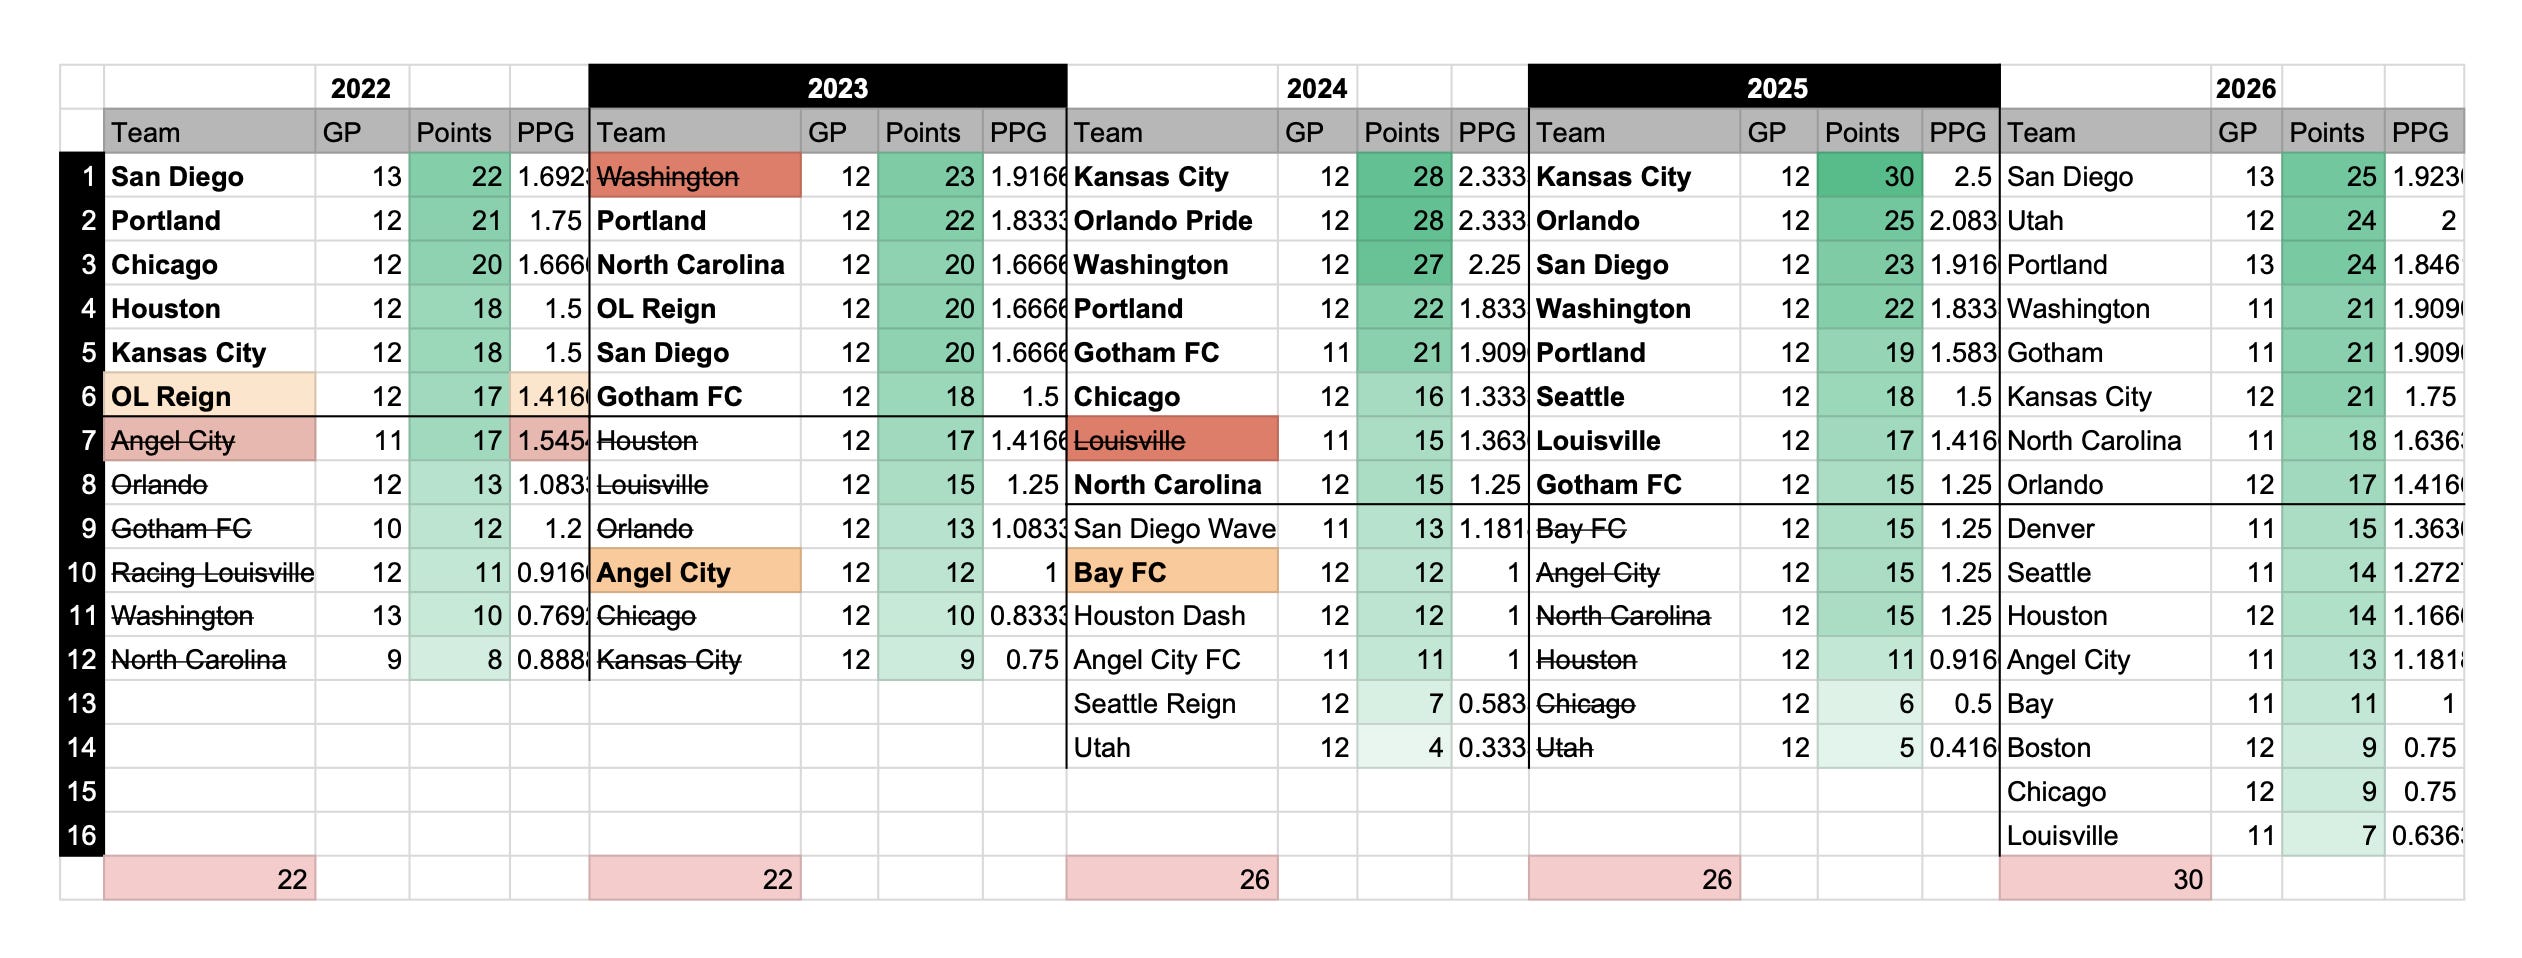
In answering that question, I sought historical context. I looked at the standings after approximately (more on that soon) 12 games for the last four years in search of how much the standings tend to change after this point in the season.
Turns out, not a lot. The teams above the playoff line after around 12 games from 2022-2025 were exactly the ones that ultimately did make the postseason, with just two exceptions: Angel City, which was in 10th place after 12 games in 2023, replaced the Washington Spirit above the line come playoffs that year. In 2024, it was also the Week 12 10th-place squad, Bay FC, that rose above the line by season’s end, while Racing Louisville sank below it. The other combined 26 teams above the playoff line after around 12 games from 2022 to 2025 all qualified for the playoffs. 12 games, it seems, can indicate a lot about how the rest of the season goes.
Before we run with this trend, there are caveats to discuss.
Because of the men’s World Cup, continental tournaments, and expansion teams, this year’s schedule is less balanced than in some previous years, and teams have played different numbers of matches. Two teams have played 13 games, six have played 12, and eight have played 11. That’s an average of 11.625 games played (GP) per team, which rounds to 12, our magic number.
In 2023 and 2025, every team played their 12th game in the same week, but both 2022 and 2024 also had uneven GP numbers. For those seasons, I found the table that had the best approximation of 12 games per team. In 2022, it was the 17 July table, when teams had played an average of 11.67 games. In 2024, teams played an average of 11.71 matches on 9 June.

 | A guest post by
|